Reports and Dashboards
Reports
Usually we find it in Sales, Service and Marketing application
Report folders
Overview
Salesforce Report Folders are organizational tools used to categorize and manage access to reports in Salesforce. They help in maintaining an organized structure, allowing users to find and access reports quickly based on their permissions.
Key Features
- Organization: Allows grouping of reports into folders based on themes, departments, or any other categorization.
- Security: Controls who can view, edit, or manage reports by setting folder permissions.
- Sharing: Facilitates easy sharing of reports with specific users, groups, or roles.
When to Use Report Folders:
- Team-Specific Access (Share folders): Use report folders when reports are to be accessed by specific teams or departments, ensuring that sensitive data is only accessible to authorized users.
- Categorization: Helpful in managing a large number of reports by categorizing them into logical groups, making them easier to locate.
- Custom Permissions: When you need to set different access levels for various reports, organizing them into folders with unique permissions can simplify the process.
Best Practices:
- Regularly Update Permissions: As team roles and structures evolve, update permissions to ensure the right people have access.
- Maintain Naming Conventions: Use clear and consistent naming for folders to ensure they are easily understandable and searchable.
- Review Regularly: Periodically review the folders for relevance and accuracy, archiving or deleting obsolete reports to keep the system efficient.
Using report folders effectively enhances data management and security in Salesforce, streamlining workflows and improving data-driven decision-making.
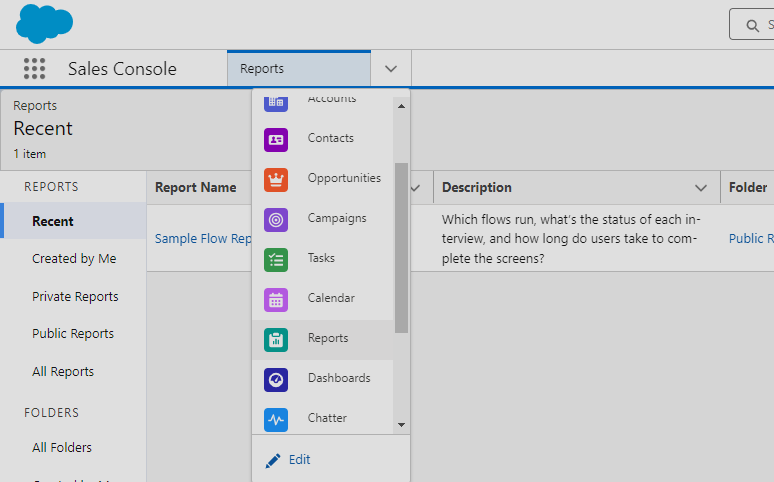
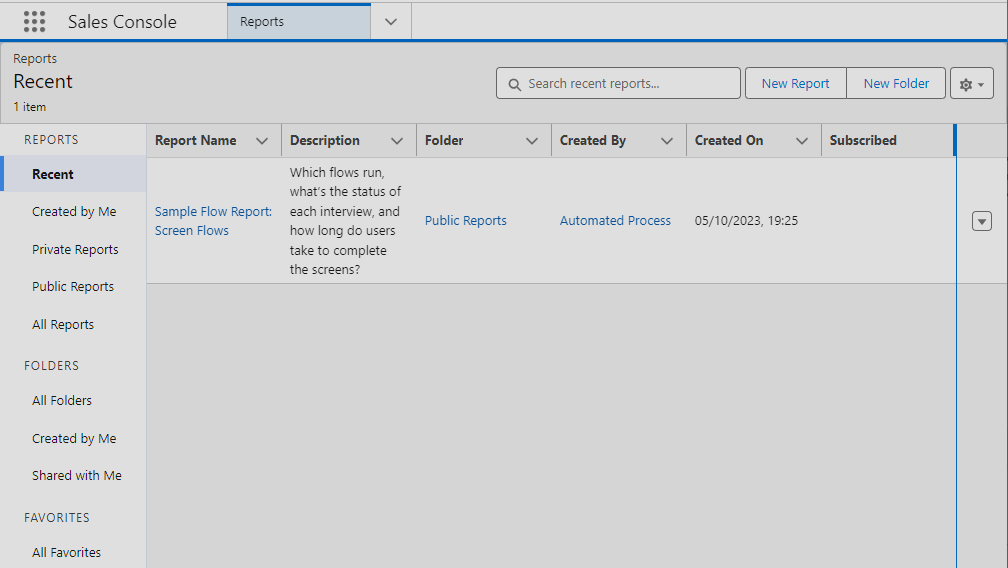
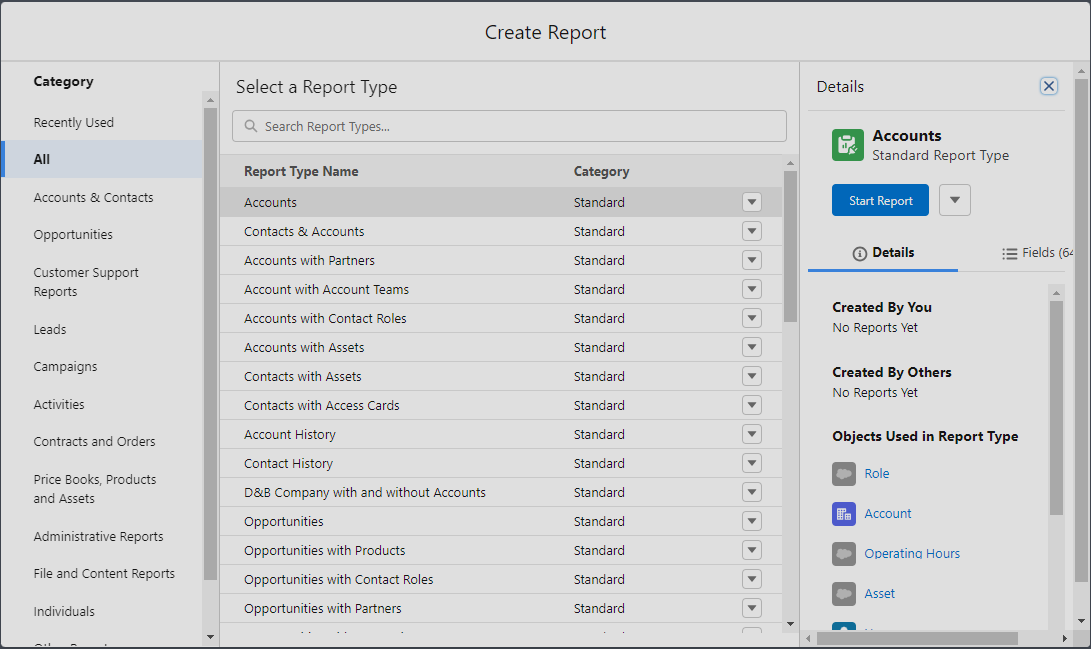
Create a report
Report Formats
Tabular report
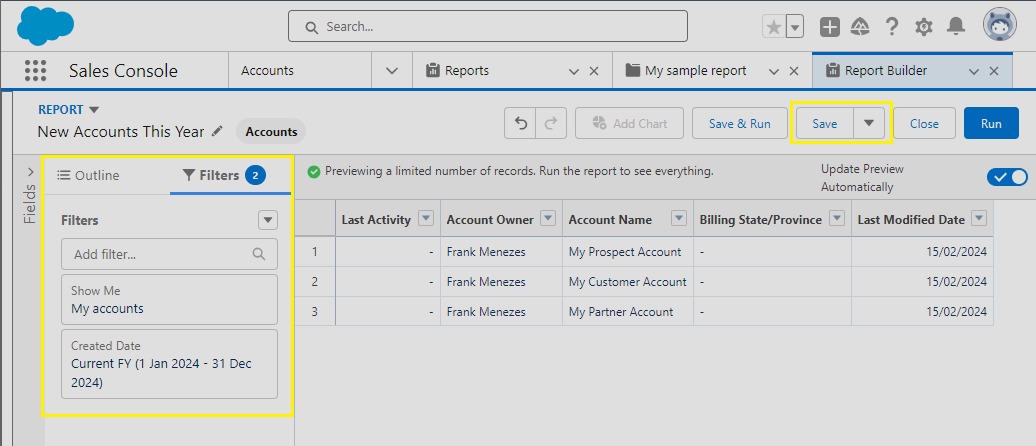
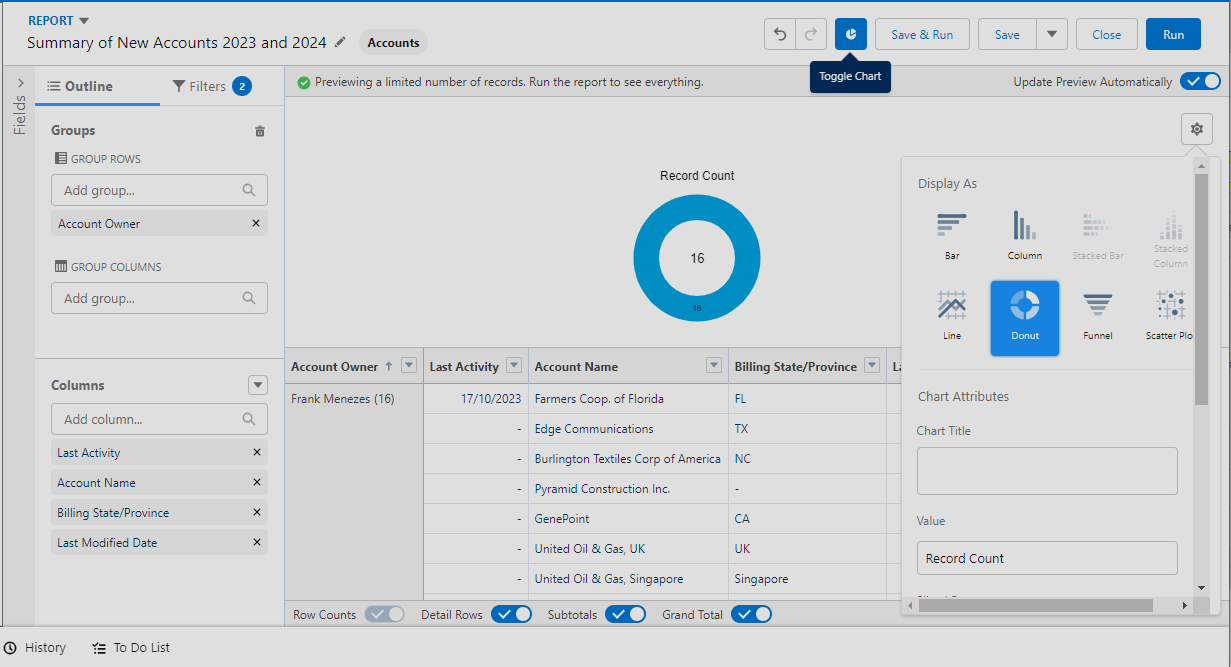
Summary report
Group by account owner, try adding chart
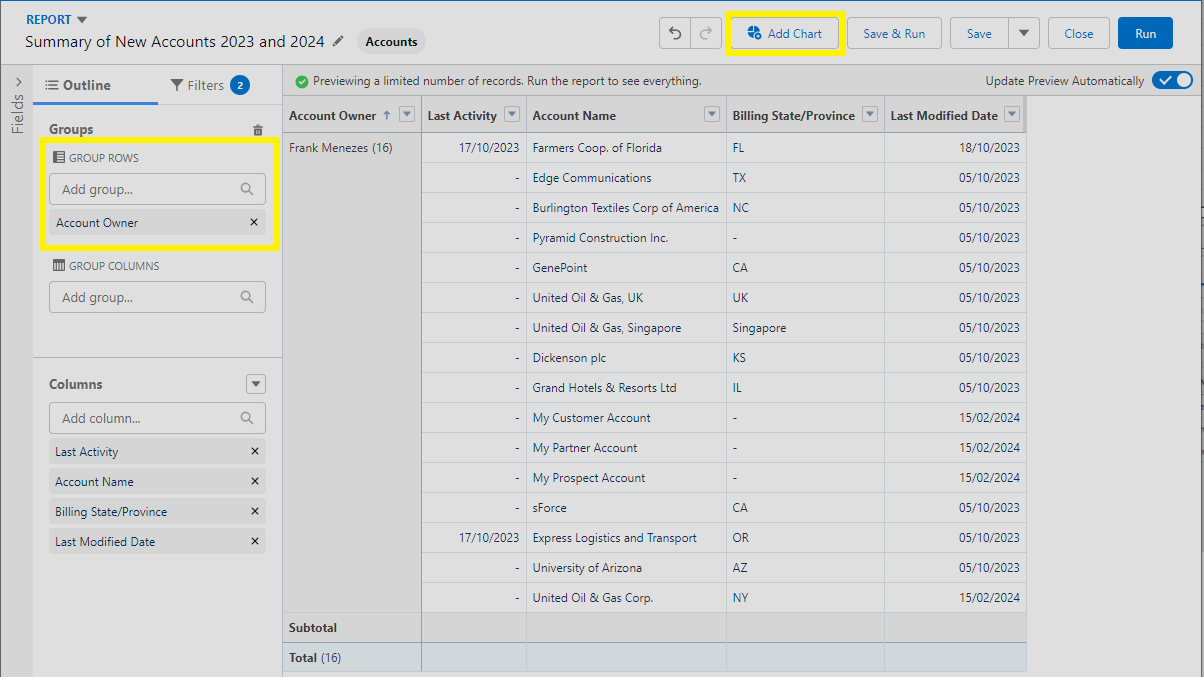
Now that you have a grouping you can add charts and toggle between tabular and chart view.
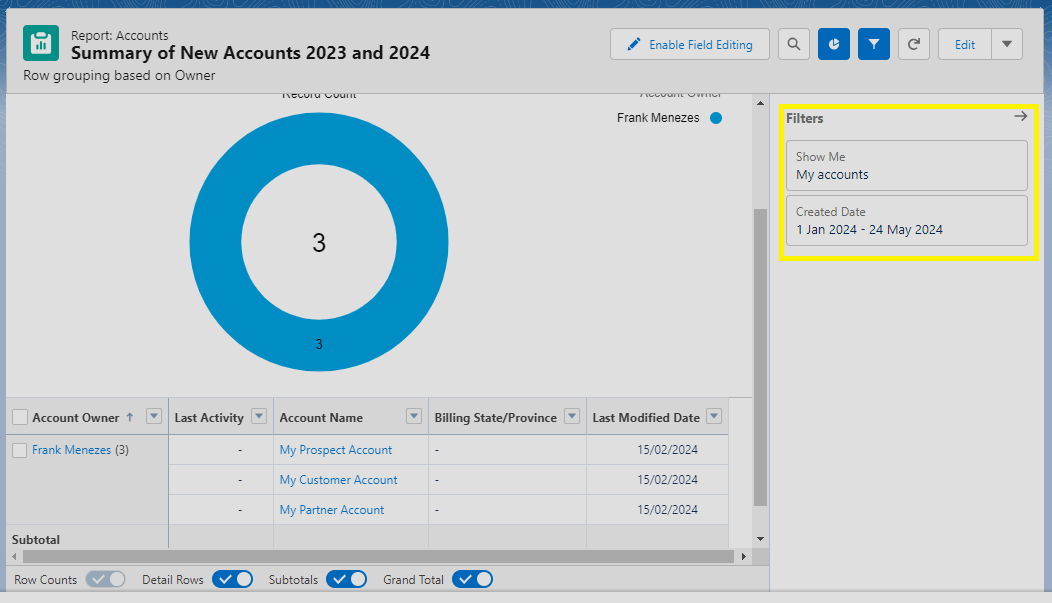
You can always filter the created report without editing it when you are in view mode
Matrix report
Matrix report is when you group by rows and columns too. You get more chart options.
Joint report
Salesforce Joint Reports are a powerful feature used to provide comprehensive insights by combining data from multiple standard or custom report types. This feature is particularly useful in Salesforce CRM to analyze related datasets and uncover trends that might not be visible through standard reporting.
Key Features of Joint Reports
- Multiple Report Types: Joint reports can include up to five different report types, allowing for a nuanced analysis of diverse data sources.
- Customizable Layouts: Users can customize layouts by arranging blocks of data in a meaningful way to highlight relationships between different data segments.
- Enhanced Analysis: These reports support complex calculations and summaries across different datasets, enhancing decision-making processes.
Examples
- Sales and Marketing Analysis:
- Report Types: Opportunities, Campaigns
- Purpose: To evaluate the effectiveness of marketing campaigns on sales revenue.
- Customer Service Efficiency:
- Report Types: Cases, Calls, Customer Feedback
- Purpose: To assess the efficiency of customer service teams and their impact on customer satisfaction.
Visual Representation
A typical Joint Report setup in Salesforce might look like this:
- Block 1: Sales data from the current fiscal year.
- Block 2: Marketing campaign data with metrics on customer engagement.
- Block 3: Customer feedback scores linked to specific campaigns or sales events.
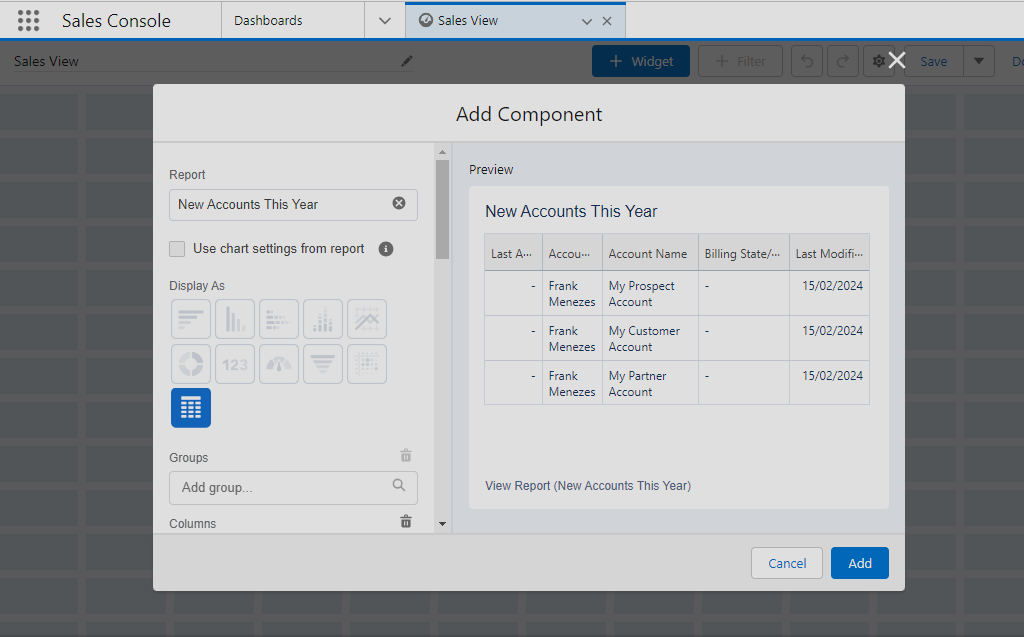
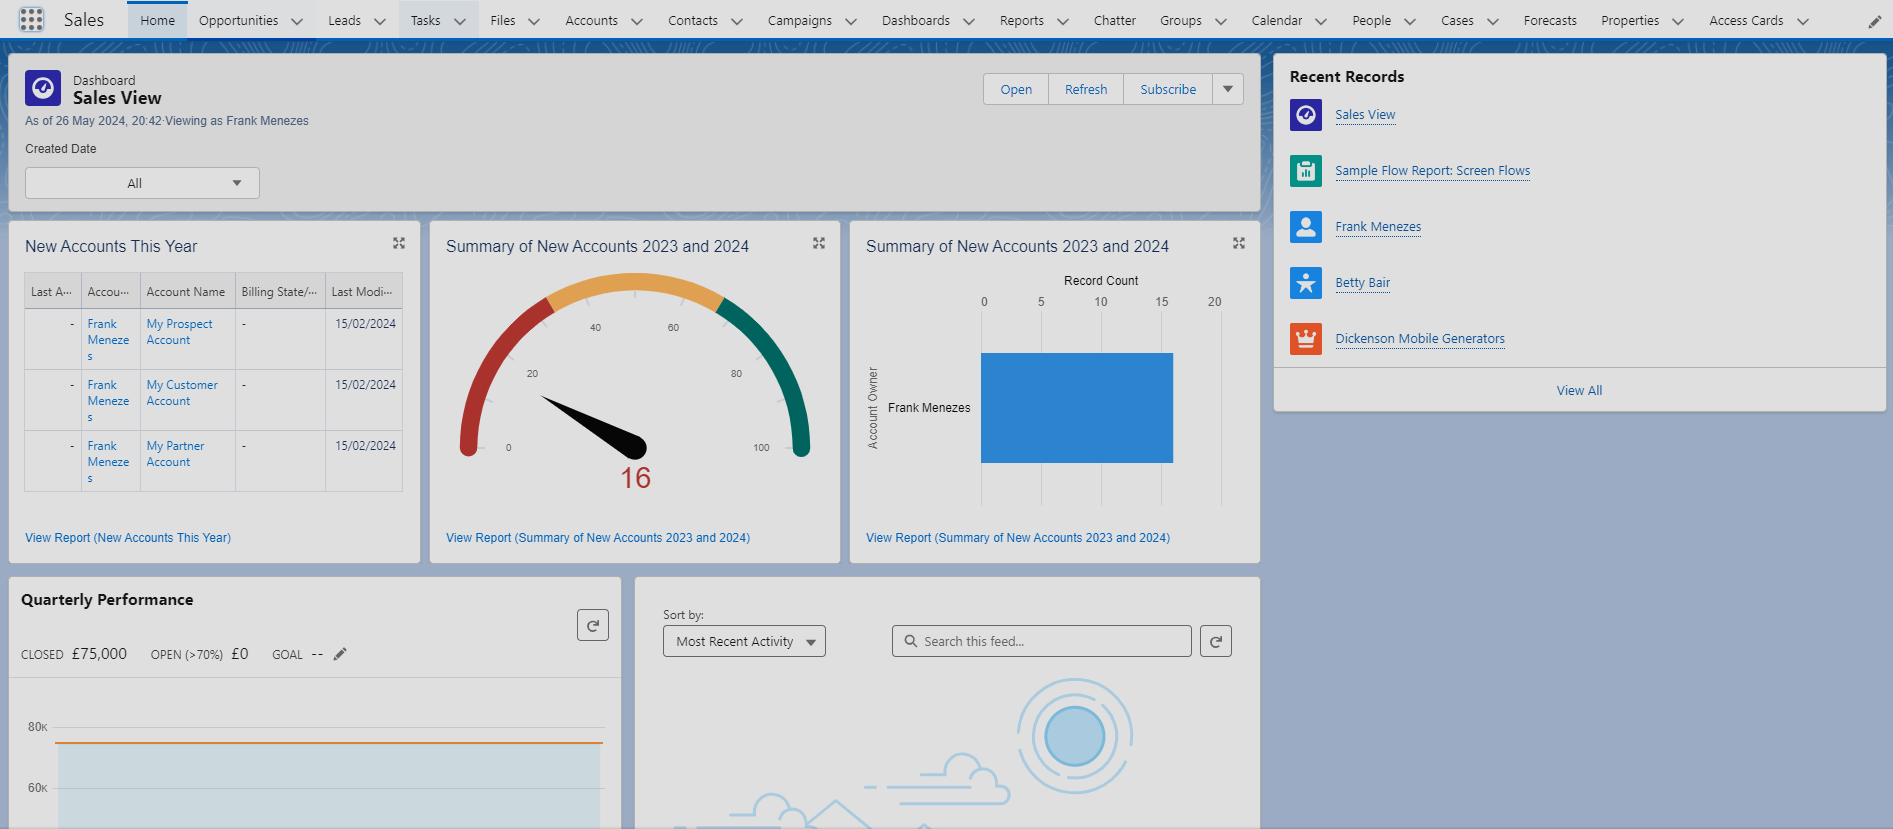
Dashboards
When you create a dashboard you would require a source report
Create dashboard
Select Dashboards tab → new Dashboard (create a folder) → Add components
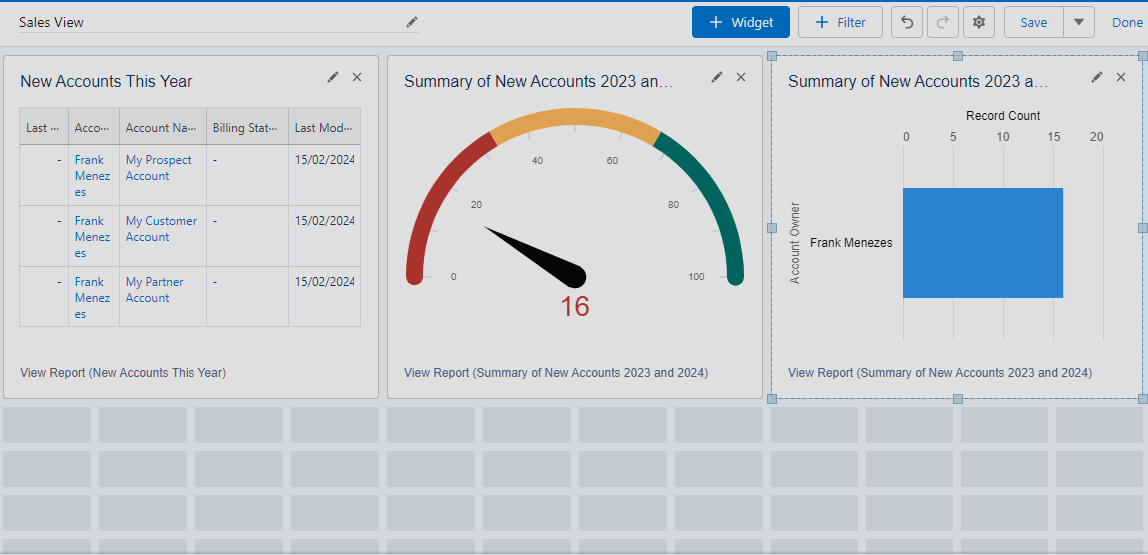
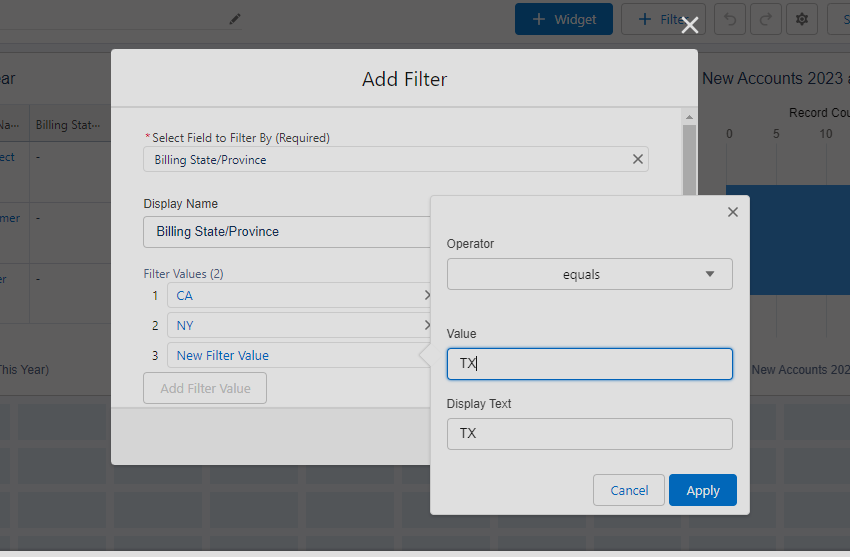
Dashboard filters
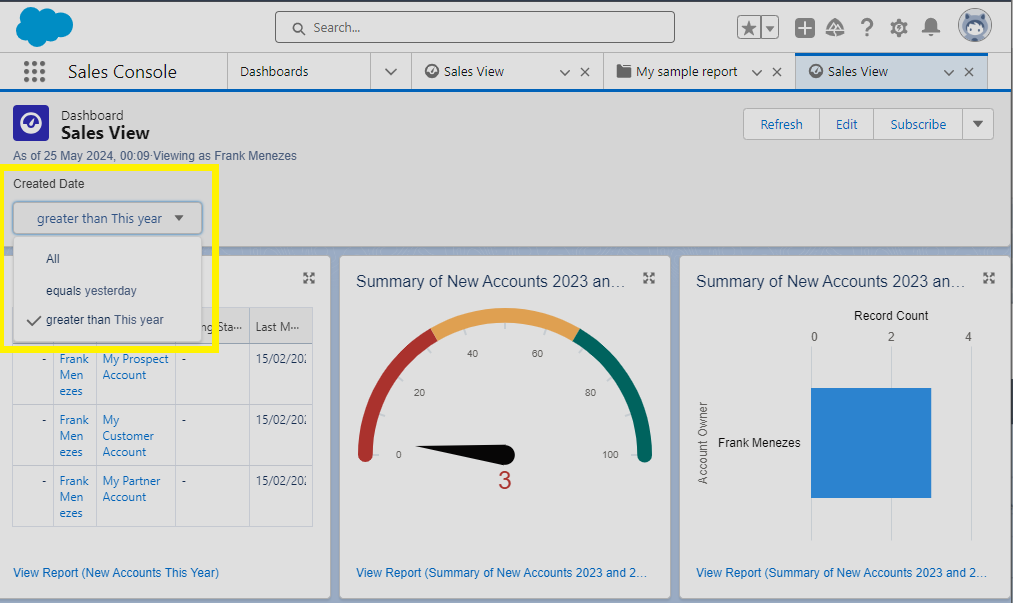
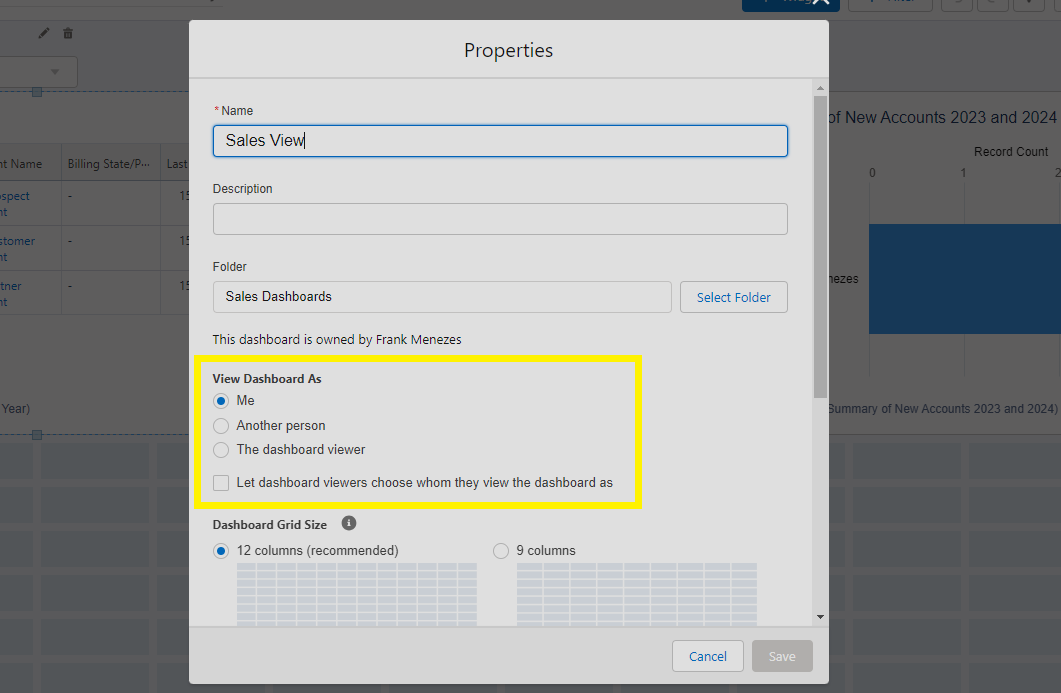
Dynamic dashboards
Dynamic dashboards in Salesforce are customized user interfaces that display data tailored to specific users based on their access permissions and roles. They allow for real-time data visualization that updates automatically as the underlying data changes. This feature enables a personalized dashboard experience for each user, ensuring that individuals only see the most relevant and allowed data.
Custom lightning homepage with Dashboard
The Lightning App Builder in Salesforce is used to create and customize the user interfaces of applications with a drag-and-drop interface. It enables users to design pages, integrate various components, and build single-page applications without needing extensive coding knowledge. This tool is particularly useful for customizing Salesforce environments to better fit specific business processes and user needs.
Create lightning homepage
Goto lightning app builder (in setup) → Create page → Select Home page
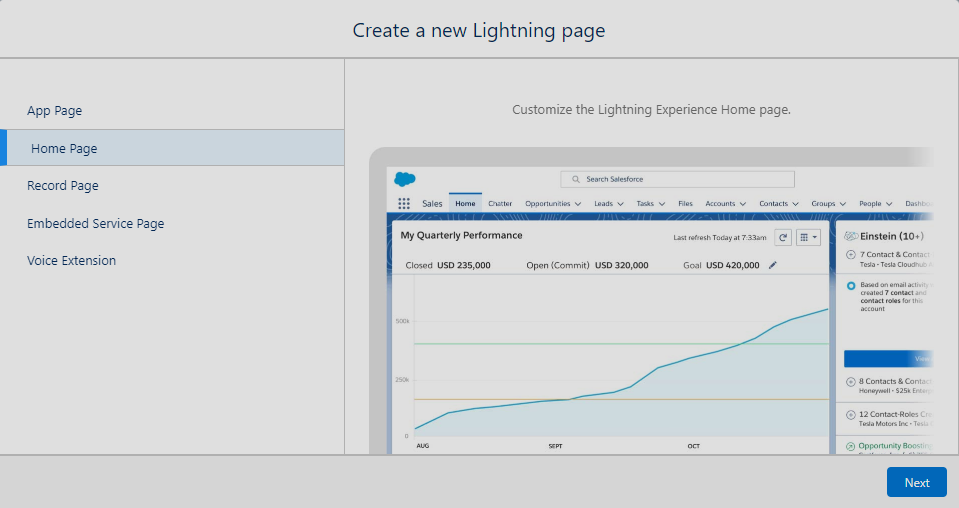
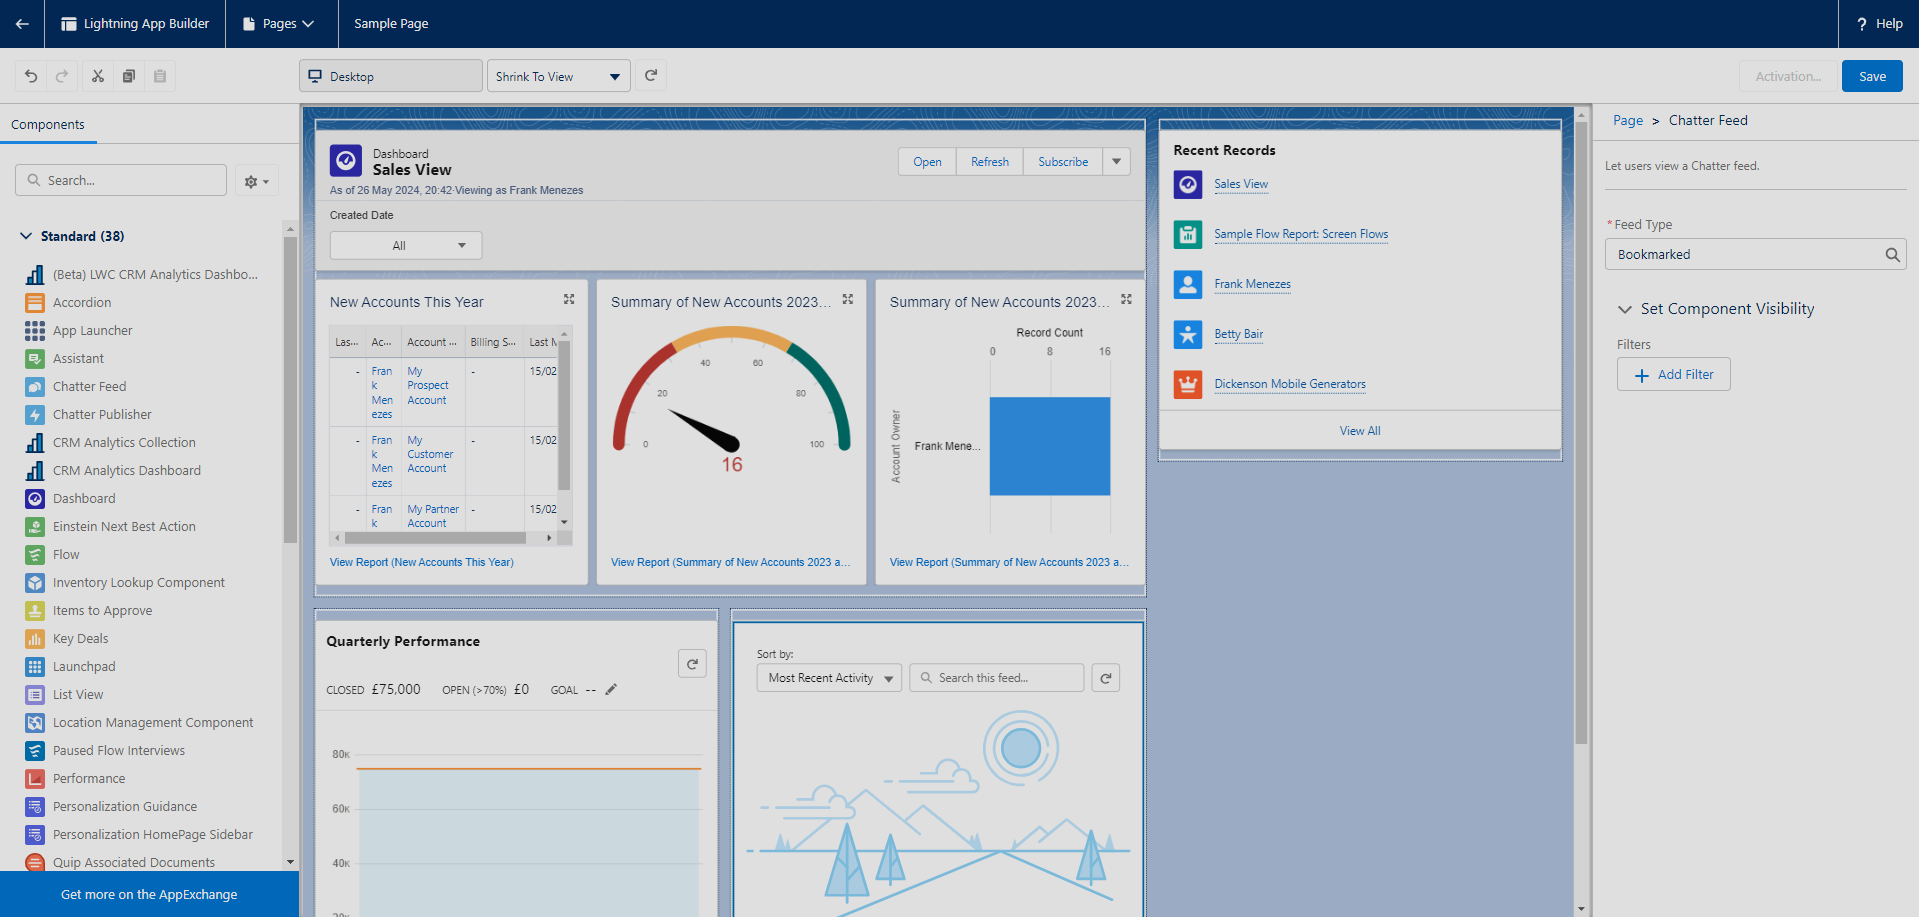
Save and Activate. Select it as default for app (Sales)
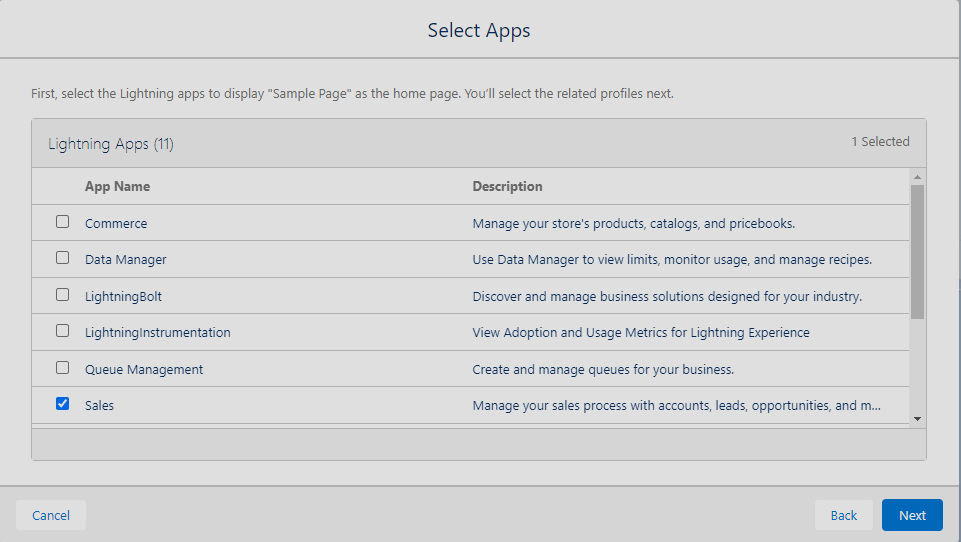
Now goto, App Launcher → Sales and you will see your homepage activated!
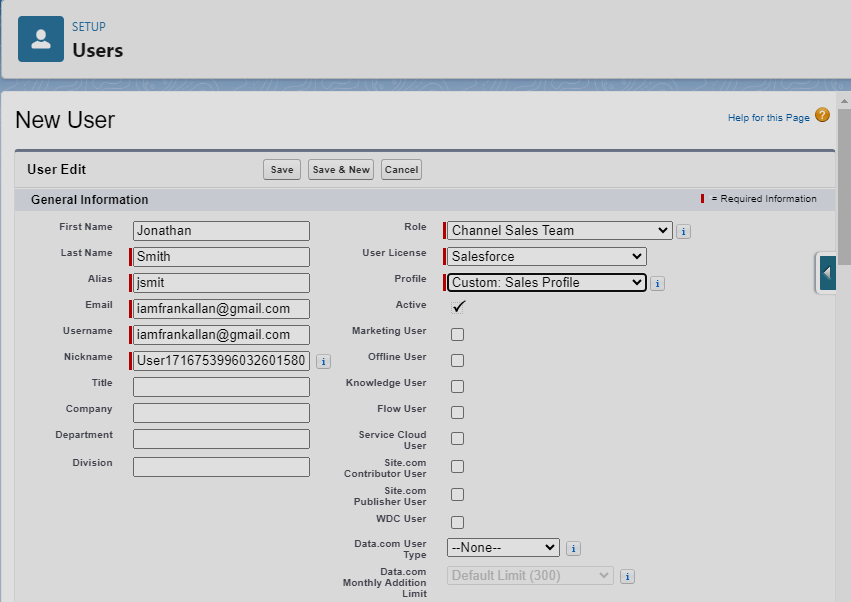
View dashboard as another user
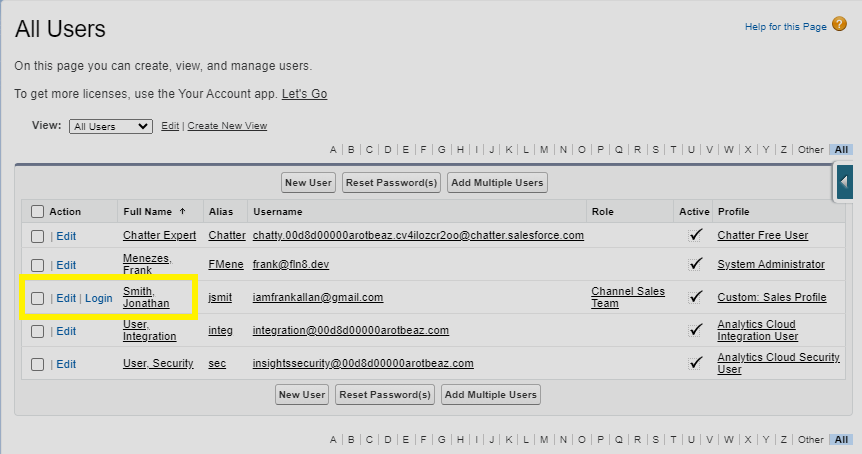
Login as another user in your org
Create new user
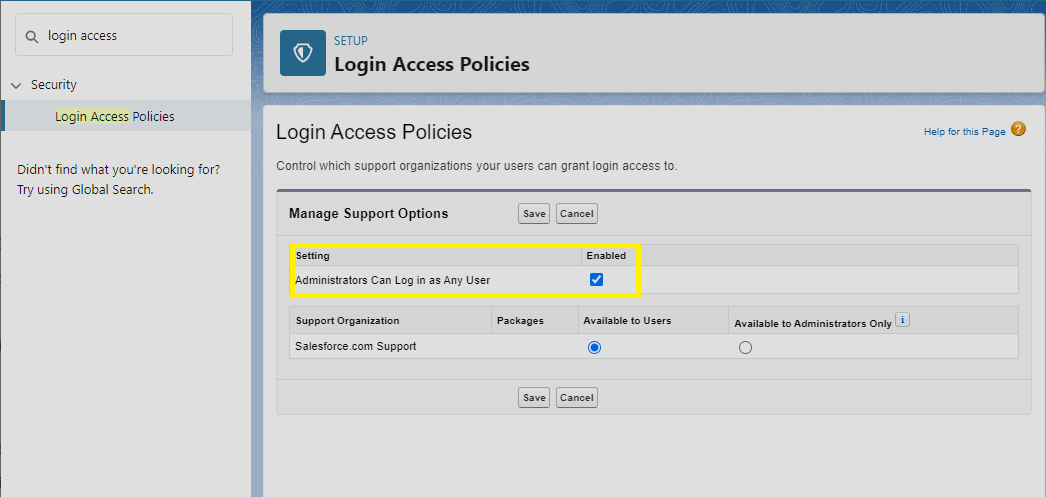
in Setup, Security → Login access policies (enable as shown below)
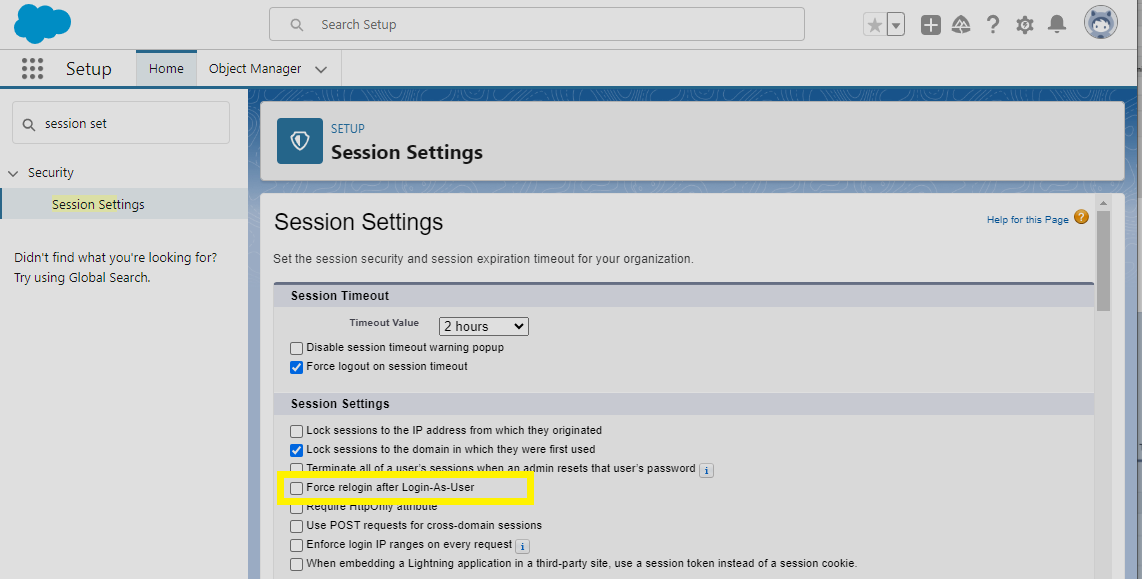
Uncheck force login
You can now login as that new user (for debugging purposes)
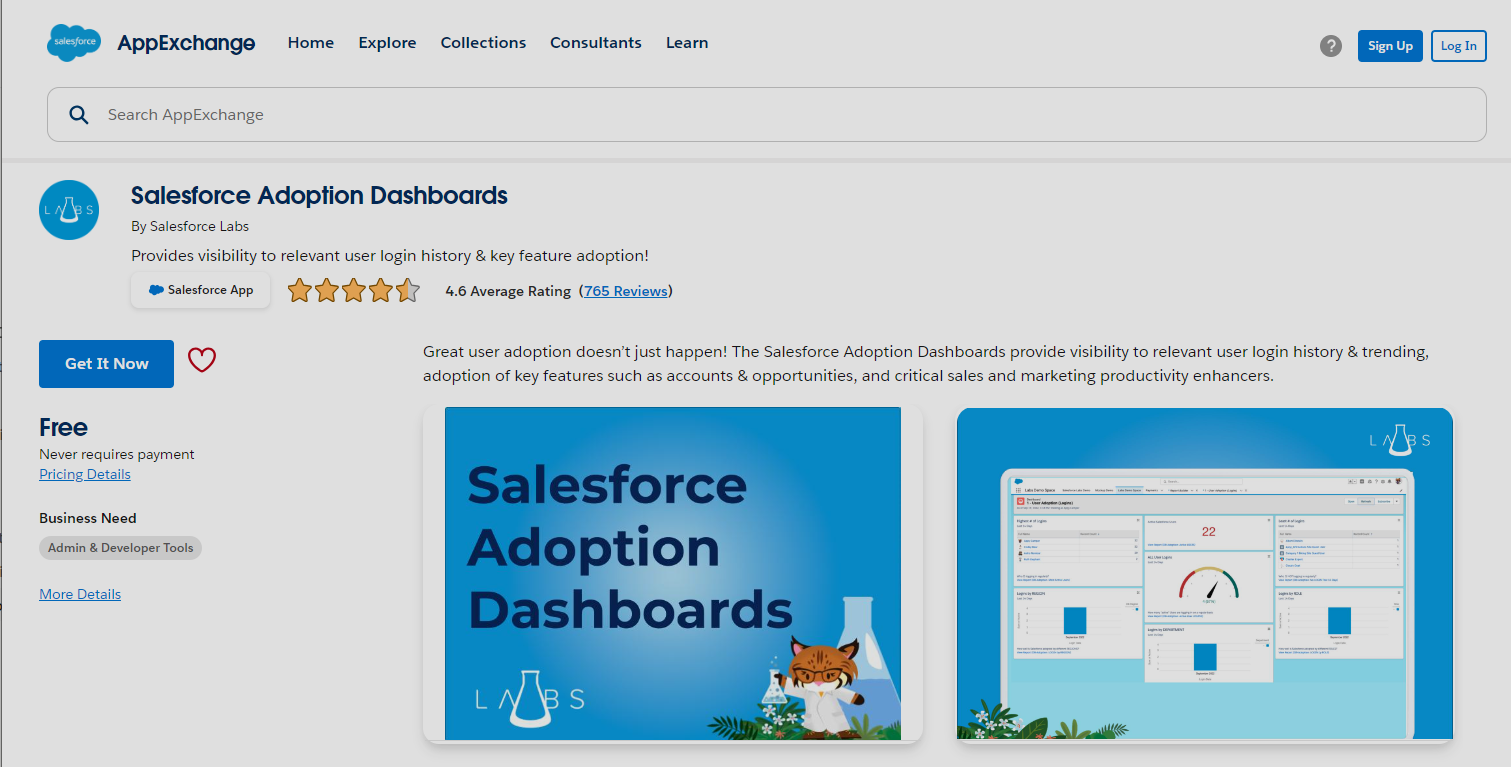
Salesforce adoption dashboards